In today’s fast-paced world, corporations cannot stress enough on quality. With increased globalization and the advent of the Internet and social media, people not only have more choices but they are also aware of those choices.
With the clutter of marketing messages consumers are exposed to on a daily basis, brand loyalty is becoming harder to build and maintain. If a customer today has a bad experience with a particular product, he or she is not only likely to switch to a competing brand, but can also be expected to share that unsatisfactory experience with friends, family and others on social networking sites.

Operations management plays a significant role in the maintenance of quality in an organization’s products and processes. One of the most popular methods for quality control is Statistical Process Control (SPC), an analytical decision-making tool that facilitates the monitoring and control of processes. It allows one to examine a process in order to detect any variation in it that might require correction.
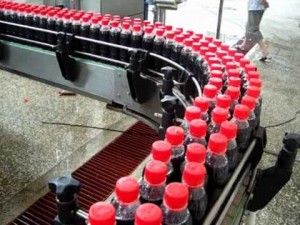
For instance, at a soft drink manufacturing plant, SPC may be used in the production process in which the finished product is filled into PET bottles. The cola filled into a 500mL is hardly ever exactly 500 milliliters; it could be 500.04mL, 499.98mL, 499.93mL, etc. Statistical process control will use a sample of bottles filled at a particular plant to determine the variation in the average volume filled.
I came across a practical application of SPC during an internship at a global manufacturer of consumer goods. A Statistical Process Control analysis at a shampoo-manufacturing facility revealed that the liquid volume filled in 400mL-shampoo bottles was consistently ranging between 400.4mL and 400.9mL. Although this is even less than half a milliliter, a large company could have suffered significant unnecessary costs if consumers were constantly given more than 400mL shampoo in the long run.

The management suspected that the volume irregularity was not due to a natural or common cause. Control charts constructed for the bottle-filling process confirmed this notion. The variation lay outside the control limits and was therefore due to an assignable cause not part of the original process design. It turned out that one of the levers in the filling machinery was not functioning correctly and allowed more liquid to enter the shampoo bottles than it was designed to fill. The SPC analysis consequently allowed us to identify this problem fairly early and re-calibrate the equipment before much money was lost.
An article by Manus Rungtusanatham in the Journal of Operations Management states that the benefits of SPC are much more than just improved quality and cost cutting. Research has shown that the implementation of statistical process control in production environments works to motivate process operators. As these front-line workers become more satisfied with their jobs, they are more motivated towards continuous improvement and high quality.
With all its advantages, SPC does have some limitations. When performed regularly, continuous inspection can be quite expensive. While the cost may be justified for a large manufacturer such as P&G, is Statistical Process Control as relevant for smaller companies too?