Home Depot Margins Higher Now Than Before Housing Crash – Thanks Logistics!

After over 30 years in business Home Depot admitted their supply chain processes were not a priority for many years. The main priority was expanding the business. When the housing market crash began in 2006 they knew they had to shift their focus. As Home Depot CEO Frank Blake explains, “A downturn is a terrible thing to waist.”

Most Home Depot stores are large warehouse stores with ample extra room for inventory and storage, but they began opening smaller stores in smaller markets that could not hold the same amount of inventory. This lead to stock-outs and unhappy customers. They realized it was time they completely changed their supply chain processes starting with centralizing operations by rebuilding their distribution process. Before 2006 only 30% of the orders were store-centric, while managers made 70% of the orders. The transportation model had its own similar shares of changes to be made. They started with the construction of 24 new rapid deployment centers located throughout the country, each would serve about 100 stores. These facilities were to be flow-through facilities for quick cross-docking and little storage. The RDCs allowed their products to be shipped with 24 hours of arrival now. Currently, one third of the RDCs are built and being used. Home Depot is already seeing the benefits.

It seems Home Depot may have chosen the perfect time for their restructuring because now that their new processes are beginning to run the housing improvement and construction markets are growing. Home depot’s margins increased 35%, net income for the fourth quarter increased 32%, and sales rose 6%. Ms. Tome, the chief financial officer of Home Depot, claims the restructuring of their supply chain processes is the reason for these large increases.

Home Depot is not only the leader in the improvement industry, but is the second largest retailer in the country, second to Wal-Mart. Can we expect to see greater growth as the last two thirds of their RDCs are implemented? How can other retailers learn from Home Depot’s changes?

http://topics.nytimes.com/top/news/business/companies/home_depot_inc/index.html

http://www.dcvelocity.com/articles/20090801verticalfocus/

What’s In Your Bag?


Golf, one of the greatest games ever invented; enjoyed by millions of people across the world. With advancements in technology and designs, golf clubs have evolved into complex equipment that was completely unimaginable in just a few decades ago. Twenty years ago golfers would go to the store and purchase a set of clubs that feels good to them. These clubs were put together on an assembly line through the use of a product focus strategy that yielded high volume and low variety. As the game evolves over the past couple of decades so have the taste of golfers and the production process of golf clubs manufacturers.


Got Ping!

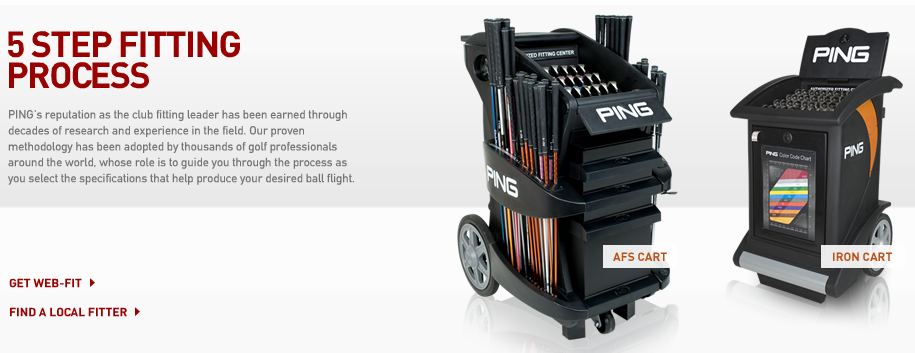
Founded in 1959, Ping Golf has become a powerhouse in the golf industry. They are well recognized by their innovation in custom club making. When Ping introduced their fitting system 10 years ago, they offered golfers with custom made clubs based on their physique and swing type. This was made possible by utilizing a repetitive focus strategy in their production process. Ping would make different clubheads with various lie angle and offset, shaft with different length and flexibility, and grips of different diameters. By measuring a golfer’s physique and analysis his swing, Ping is able to use the data to create a unique set of clubs by combining various components already manufactured. Ping’s production process is similar to that of Harley Davidson, where modules are combined to form many output options. Although Ping’s production process costs more than the traditional continuous flow process, it gives them a competitive advantage that is well worth.

Click here for more information on Ping’s fitting system: http://www.ping.com/fitting/5steps.aspx


Is not your daddy’s old club!

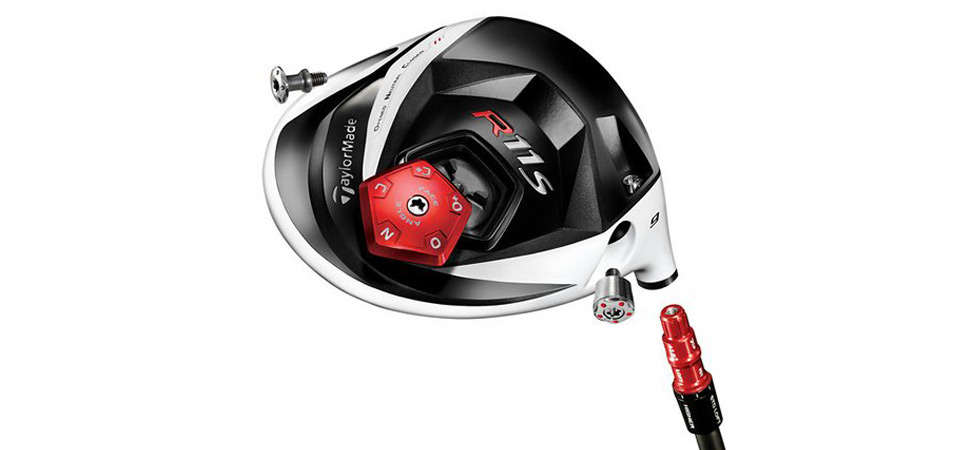
As other manufacturers try to gain competitive advantage in customization, a new evolution in club making has begun. TaylorMade just launched their new R-series driver, which embodies full customization while maintaining a low cost continuous flow production process. The R11S Driver offers loft, clubface, and center of gravity adjustments by having tuning devices build within the clubhead. This innovated design allows golfers to adjust the club to a specification suitable for them, and changes to previously set specification can be made again at any time. In terms of production process, TaylorMade only has to manufacture one type of clubhead, which greatly reduce production cost. Of course, the production of such elaborate clubhead requires additional research and development, and the cost of each clubhead is more than the traditional non-adjustable clubhead. But in the long-run, utilizing a continuous flow process will be less expensive in meeting market demand of customization.

Click here for more information on TaylorMade R11 Series Driver: http://taylormadegolf.com/taylormade/R11S-Driver/DW-JN721,default,pd.html?start=1&cgid=taylormade-drivers-r11s


The R11 series by TaylorMade is a great example of achieving customization while maintaining a low cost continuous flow production process. Do you know any products that can also do that?


Works Cited

Ping. (2012, 07 09). Custom Fitting. Retrieved from Ping Golf: http://www.ping.com/fitting/default.aspx

TaylorMade. (2012, 07 09). R11S Driver. Retrieved from TaylorMade Golf: http://taylormadegolf.com/taylormade/R11S-Driver/DW-JN721,default,pd.html?start=1&cgid=taylormade-drivers-r11s


Transforming Waste into Profit

Deishin Lee, a professor at Harvard Business School, is conducting a research paper on the way manufacturing companies can turn their waste into by-products.  By-product synergy (BPS) is basically taking waste from one part of the production process and using that waste in order to generate a new product.  The idea of BPS in not a new, as it is most often used in the agriculture industry.   Furthermore, she explains that in order for a manufacturing company to implement such an idea, it is important for the managers to “stop thinking of yourself as a company that creates a certain product and instead think about how you can use them to produce as much value possible.”

Since Lee is researching about recycling, she talked with Gordon Forward, CEO of Chaparral Steel.  His company use wastes from producing steel to make cement.  After an interview with Forward, she concluded that the main challenge as mentioned above is thinking outside the box, to produce an innovative product that companies/consumers will be able to purchase.

As a result of her research, Lee was able to come up with three scenarios for BPS.

1)      In a case where the by-product is a low value, a company may choose to maximize profits by using only a partial amount of the waste to produce a new product.

2)      In the second case, if the value of the new product/by-product increases, then the company might choose to actually increase the production of the primary product in order to create more “waste.”

3)      Lastly, Lee proposes a scenario in which the by-product ends up being more profitable then the primary product.  She suggests it would be wise for a company to find virgin material to make more of the secondary product.

Although using the wastes of a particular product can be beneficial to the company, it may not end up being so good for the environment.  Lee points out that sometimes using by-product to make new products can lead to more pollution.  Do you think companies should push manager into thinking “outside the box,” in order to find ways to use the waste?

Source: http://hbswk.hbs.edu/item/6800.html


Keep an Opened Eye on Consumption

I am going to focus on the concept of car consumption and how it relates to the importance and sage of control charts in quality management for my company.

Control charts are used to monitor variations in given a variable for the purpose of making sure that the process is on control. The types of variations are assignable or common.

 The company I work for is in the entertainment business and we have a large set of cars assigned to track and off-track activities. Some of these cars are specific for racing activities are others are just tuned road certified cars. The process of maintaining these cars in a good operating condition involves a series of periodic general inspection, regular change of parts and oil and fuel filling not to mention the inventory of parts which accounts for the largest percentage of money spent on all. Expenses of which the company dedicates a substantial amount of money under the category of cost of doing business.

Our operations department utilizes control charts as an indicator if something is going wrong. One of the variables they focus on is fuel consumption. What was really interesting to me is how specific the process of putting control charts was. The process involved factors like the type of the car, the weather conditions it operates in and the car depreciation value which relates to its usable lifetime. Each one of those affected the level of consumption and it happens that we get a reading for one of the cars beyond the control limits that will indicate that there something wrong with the car and it has to be inspected. Other control charts are prepared in the same manner for the other variables affecting the condition of the car.

As per our operations director, gathering the right set of data is the most difficult part. You will be able to obtain most of the consumption and car wear and tear variables as per industry standards or from the manufacturers themselves. One of the common mistakes is that you will base all of your charts based on them. You will have to collect your own and have a variance analysis just to make sure that you do not get misleading results at the end of the day.

 What I would to add here is regardless of how prepared we seem to be by keeping an opened eye on consumption we had the occasional unexpected breakdowns of some of our vehicles. Despite the fact that the last check was completely perfect. We had other cases in which we were using the wrong limits for our charts and ended up being reactive at the expense of quality.

Would the concepts of quality management and your business relevant statistical process control charts make sure that you have the perfect quality product in the market? In my line of business, it would minimize the risks and based on experience it is not a guarantee. What about yours?

Cinderella’s shoe, does it fit everyone?

Husband and Wife both are Six Sigma practitioners. Obviously, their daily lives conversations happen in Six Sigma parlance. The wife happens to be a very good cook, one of the reasons why the husband married her. Suddenly, three days at a stretch, the food starts to have extra salt. Husband objects, to which wife responds

“Common Cause of Variation”. One day, the wife adds a lot of salt to the food. Husband takes ill and is admitted to the hospital. Wife comes to see him and quips, “Sorry, special cause of variation.” Husband says, “It was Structural.”

Three days later, Husband hands out a divorce notice to wife and quips, “Process Unstable. Not meeting CTQ*.”
*CTQs are the internal critical quality parameters that relate to the wants and needs of the customer.

Thought of sharing this joke as I believe it will help us all in remembering few vocabularies used during our last session.

The last few session reminded me of one of the main product development projects that I’ve worked on, where we launched one product in 7 different markets, however we had to customize it a bit for each market in order to meet customer expectations in each of the 7 markets.
The product was basically a credit card in local currency, you may wonder what is so special about it? Well it was an American Express local currency Credit Card.  And as you may know, American Express is considered the most prestigious plastic card in the world, and it targets individuals with high expenditure patterns. Refer to this blog for American  American
Express’s Competitive Position
.

As this may be very true for its main product “the Charge Card”, it was not applicable for their Credit Card target segment, which made the product development & marketing teams wonder of what would attract customers to American Express Credit Card rather than any other credit cards available in their market? Well the development team followed the differentiation strategy while designing the product. It was the feel of the prestigious card that attracted customers to it, in addition to the appropriately designed product that met customer’s expectation in each of the targeted markets. But how did the development team identify the customer needs? They utilized their existing data and referred to the Charge Card customer base, they asked them if they would like to hold supplementary Credit Cards for their spouses and children with a credit limit, and bang that was highly demanded. As loyal cardholders they didn’t want to hold many different brands of cards and also didn’t want to  provide the open limit charge card as supplementary cards to their family. Of course further focus groups were obtained then to identify the requirements of each market, and to develop a product that is different than the current ones in the market. Tremendous amount of work was held but it was worth it, the product was launched successfully and it was well perceived in all 7 different markets.

However, do you think what AMEX did for identifying customer’s needs in each market was enough? If not, what alternative ways would you suggest?

Do you have a Toyota?

Do you remember the Toyota recall in Bahrain? Have you ever thought what really went wrong and why Toyota is recalling those vehicles?

I’ve read an interesting paper What Really Happened to Toyota?  that was analyzing the different recall acts of Toyota which took place in USA due to quality and safety issues. The paper analyzed the main reasons behind such issues as the brand image and sales revenue were severely impacted.

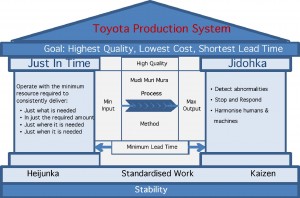
 Toyota and its chain of suppliers had always pioneered quality management methodologies of total quality control since they believed that quality, customer satisfaction and profits are deeply connected. Quality is a major component of Toyota’s strategy and production system, and was always looked at as a role model by other competitors, such as Ford, GE and Honda.

So what really happened that made “Quality” suffer?

The paper states that there are two main reasons behind the quality issues:

  1. Toyota executive management always believed that quality should have a high priority, however, when the new management came in, their focus has changed. The new focus was on rapid growth rather than quality. As Toyota expanded in new markets, from 2003 onward their sales grew faster than the company can manage, and therefore, growth had taken priority over the traditional focus on quality. The decisions were made in favor of meeting sales, cost cutting and profit target while sacrificing product development, supplier management and production.
  2.  The second reason is a result of the increasing complexity of car products due to technological changes. Government regulations on safety, emissions and fuel consumption and the rising customer demands for environment friendly cars with luxury features have all added to the complexity level. This point applies to other car manufacturer as well, but due to the continuous demand and market expansion, Toyota was faced with the challenge of changing its production process to meet the demand of safe, clean, fuel-efficient and comfortable cars.


Some of the process change decisions were to compress the lead time between exterior design approval and start of sales to less than 20 months. Another change in process was to introduce an accelerated design cycles that have stressed the development and production systems which have created conditions for quality failure.

 Toyota’s supplier management and its performance were also affected by the above two points. To meet the rapid demand and product complexity, Toyota had to outsource engineers and contract with new suppliers because the current engineers and suppliers were not sufficient. Most of those contract engineers and suppliers were inexperienced with Toyota’s standards and practices, and they were overseas (none Japanese speakers) contacts which had lead to coordination and communication problems.

I think that for any company, risk assessment should be conducted before moving with growth and expansion decision. With Toyota, the quality has suffered because they banded their core values of quality and focused on growth.

In your opinion, what went wrong with Toyota?