Marketing Driving Quality Control

While it’s true that upper and lower boundaries for SPC charts can be set by using some measure of central tendency and typical variation, there are sometimes other factors that will be used to determine process control limits. At Dremel, a power tool company owned by Bosch Power Tools, we heavily monitor and control our manufacturing processes. Dremel makes a line of light-duty power tools aimed at the DIY homeowner and craft/hobbyists markets. Many of their applications necessitate some degree of tool precision (of cut width, straightness, depth, smoothness, etc.) and so our processes are designed to achieve that end. Specifically, our manufacturing process controls for the presence of runout (misalignment between the tool axis and the cutting surface) and tests to look for excessive misalignment.

The interesting thing about our particular operation, though, is that the upper boundary for acceptable misalignment is not a function of the standard deviation of our process. Sure, it can be defined that way, but the number itself wasn’t selected using a statistical model. Rather, it was a marketing driven decision. Our product marketing group did extensive consumer insight research to determine what level of precision mattered for the types of projects our customers undertake. After determining that they were happy so long as the tools were at least some level of precise, the team reworked the manufacturing operation around achieving those numbers.

Of course Dremel uses some of the SPC tools we discussed in class to control its operations. For example, we track the number of defects and percent defective. It’s just that SPC isn’t the only framework in controlling our manufacturing process. Marketing, logistics, and other business functions also get involved and have a stake in making sure the products get made a certain way and according to a certain procedure. The manufacturing unit has to be responsive on all those fronts.

The point of bringing all of this up is two-fold. First, I wanted to highlight that in industry, while many of the operations management tools discussed in class are used, they are not applied in a vacuum and might be modified for a firm’s unique needs. Second, I wanted to encourage thinking about areas where  business functions begin to overlap. Where disciplines begin to intermingle, we need to have some way of making decisions about which framework (or frameworks) ought to take precedent. We need to really understand the goal being pursued and select the most appropriate bits from marketing, finance, accounting, operations, etc., to maximize success.

Are there any instances from your experience where one discipline seemed to be calling the shots in another’s area of expertise? (Exs. Did marketing ever drive finance? Did operations ever affect accounting?)

Intake of Lexapro Medication Linked to Birth Defects

Welllbutrin Lawyers Handling Birth Defects Cases


The effects of consistent and continuous intake of medications containing selective serotonin-reuptake inhibitors, such as Lexapro, has been tested for various side-effects. Recent tests have shown a significant correlation between such medications and the number of  newborn children born with pulmonary hypertension for medicated patients.  While this these statistics do not pertain directly to seller’s risk or buyer’s risk of the manufacturing company of Lexapro and the intermediaries, which sell this medication directly to the public, these statistics do relate to the seller’s risk and buyer’s risk of the manufacturing company of Lexapro and the genreally medicated public, respectively.

Past a certain rate of occurrence, or once the correlation between the intake of medication containing selective serotonin-reuptake inhibitors and any resulting birth defects similar in nature to pulmonary hypertension in children of prescribed patients have been proven to significant enough, the drug control agency of various governments will mostly likely restrict or ban the sale of Lexapro and similar medications.

In order to determine an acceptable rate of occurrence or statistical correlation, many of the same mathematical procedures demonstrated in our assigned readings will be utilized in the process of that determination. Buyer’s risk, seller’s risk, and statistical process control are all mathematical procedures likely to be utilized. Theories covered in our assigned reading, such as sustainability, will also be considered in the process of determination for the various drug control agencies and judicial systems likely to be involved in this case. Specifically the regulation and reputation components of the sustainbility theory will be considered, not only for the manufacturing company of Lexapro medication and the like, but also for the respective drug control agencies likely to be involved in this case. What is most important to note in my posting, in my opinion, would be that the theories and procedures described in our text and during our class sessions, do not only pertain to management operations considerations of specific companies, but they also pertain the considerations of various governmental agencies and individuals, which themselves often operate as a company and operations manager, respectively.


http://www.timesunion.com/business/press-releases/article/Lexapro-Investigation-Reveals-Severe-Side-Effects-3698320.php

http://www.lexaprobirthdefectslawsuits.com/

Home Depot Margins Higher Now Than Before Housing Crash – Thanks Logistics!

After over 30 years in business Home Depot admitted their supply chain processes were not a priority for many years. The main priority was expanding the business. When the housing market crash began in 2006 they knew they had to shift their focus. As Home Depot CEO Frank Blake explains, “A downturn is a terrible thing to waist.”

Most Home Depot stores are large warehouse stores with ample extra room for inventory and storage, but they began opening smaller stores in smaller markets that could not hold the same amount of inventory. This lead to stock-outs and unhappy customers. They realized it was time they completely changed their supply chain processes starting with centralizing operations by rebuilding their distribution process. Before 2006 only 30% of the orders were store-centric, while managers made 70% of the orders. The transportation model had its own similar shares of changes to be made. They started with the construction of 24 new rapid deployment centers located throughout the country, each would serve about 100 stores. These facilities were to be flow-through facilities for quick cross-docking and little storage. The RDCs allowed their products to be shipped with 24 hours of arrival now. Currently, one third of the RDCs are built and being used. Home Depot is already seeing the benefits.

It seems Home Depot may have chosen the perfect time for their restructuring because now that their new processes are beginning to run the housing improvement and construction markets are growing. Home depot’s margins increased 35%, net income for the fourth quarter increased 32%, and sales rose 6%. Ms. Tome, the chief financial officer of Home Depot, claims the restructuring of their supply chain processes is the reason for these large increases.

Home Depot is not only the leader in the improvement industry, but is the second largest retailer in the country, second to Wal-Mart. Can we expect to see greater growth as the last two thirds of their RDCs are implemented? How can other retailers learn from Home Depot’s changes?

http://topics.nytimes.com/top/news/business/companies/home_depot_inc/index.html

http://www.dcvelocity.com/articles/20090801verticalfocus/

Want to Save Millions? Watch Your Milliliters.

In today’s fast-paced world, corporations cannot stress enough on quality. With increased globalization and the advent of the Internet and social media, people not only have more choices but they are also aware of those choices.

With the clutter of marketing messages consumers are exposed to on a daily basis, brand loyalty is becoming harder to build and maintain. If a customer today has a bad experience with a particular product, he or she is not only likely to switch to a competing brand, but can also be expected to share that unsatisfactory experience with friends, family and others on social networking sites.

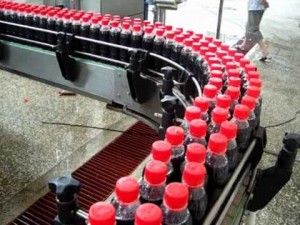
Soft Drink Manufacturing Facility

Operations management plays a significant role in the maintenance of quality in an organization’s products and processes. One of the most popular methods for quality control is Statistical Process Control (SPC), an analytical decision-making tool that facilitates the monitoring and control of processes. It allows one to examine a process in order to detect any variation in it that might require correction.

For instance, at a soft drink manufacturing plant, SPC may be used in the production process in which the finished product is filled into PET bottles. The cola filled into a 500mL is hardly ever exactly 500 milliliters; it could be 500.04mL, 499.98mL, 499.93mL, etc. Statistical process control will use a sample of bottles filled at a particular plant to determine the variation in the average volume filled.

I came across a practical application of SPC during an internship at a global manufacturer of consumer goods. A Statistical Process Control analysis at a shampoo-manufacturing facility revealed that the liquid volume filled in 400mL-shampoo bottles was consistently ranging between 400.4mL and 400.9mL. Although this is even less than half a milliliter, a large company could have suffered significant unnecessary costs if consumers were constantly given more than 400mL shampoo in the long run.

Stages of Statistical Process Control

The management suspected that the volume irregularity was not due to a natural or common cause. Control charts constructed for the bottle-filling process confirmed this notion. The variation lay outside the control limits and was therefore due to an assignable cause not part of the original process design. It turned out that one of the levers in the filling machinery was not functioning correctly and allowed more liquid to enter the shampoo bottles than it was designed to fill. The SPC analysis consequently allowed us to identify this problem fairly early and re-calibrate the equipment before much money was lost.

An article by Manus Rungtusanatham in the Journal of Operations Management states that the benefits of SPC are much more than just improved quality and cost cutting. Research has shown that the implementation of statistical process control in production environments works to motivate process operators. As these front-line workers become more satisfied with their jobs, they are more motivated towards continuous improvement and high quality.

With all its advantages, SPC does have some limitations. When performed regularly, continuous inspection can be quite expensive. While the cost may be justified for a large manufacturer such as P&G, is Statistical Process Control as relevant for smaller companies too?